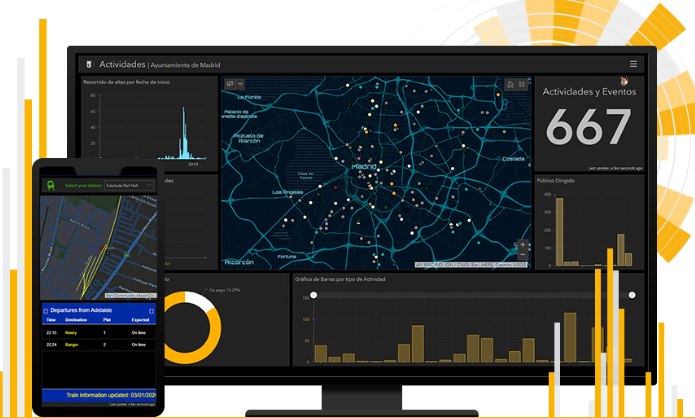
ArcGIS Dashboards
ArcGIS Dashboards is a configurable web app that enables users to present location-based analytics through intuitive and interactive data visualizations on a single screen. It allows organizations to monitor people, services, assets, and events in real time, facilitating quick decision-making and trend visualization.
Key Benefits:
- User-Friendly Interface: Dashboards are designed to be easy to understand, presenting all relevant information on a single screen for quick comprehension.
- No-Code Configuration: Start creating dashboards without any coding using a robust suite of data visualization tools, including maps, lists, charts, and gauges.
- Interactive Elements: Users can interact with dashboard elements, which are linked to provide dynamic results as they explore the data.
- Flexible and Configurable: Dashboards can be tailored to specific audiences, events, and situations, with multiple structure and design options.
ArcGIS Dashboards is included with ArcGIS user types and is accessible through ArcGIS Online and ArcGIS Enterprise.